
Wealth Insights
Why Are Stocks So Resilient? Earnings!
5 minute read time
The Big Question
Since early April, U.S. stocks have rallied sharply despite an ongoing war, rising inflation fueled by soaring oil prices (near $100/barrel), higher bond yields (up 0.6 to 0.7 percentage points), and frothy valuations (21 times projected earnings vs. a historical average of 17 times for the S&P 500 Index).
That combination seems like a clear negative for markets. So why are equities still rising? The answer is a combination of how today’s stock market is constructed, strong earnings momentum, and structural changes in the economy.
Market Composition
The S&P 500 today looks very different than it did in the past. Technology is now one of the largest sectors, with a small number of very large companies driving a significant share of returns. These companies have higher-than-average profit margins and are less tied to physical input costs such as oil prices.
The chart below shows just how complete the transition has been. In 1980, the Energy sector made up roughly 28% of the S&P 500—Exxon was the largest company in America and oil supermajors dominated the index.
Today, Energy is just ~3% while Information Technology has risen from ~4% to ~32%. The two sectors crossed around 1995 and have diverged consistently since. Including Communication Services (Alphabet, Meta, Netflix—reclassified out of IT in 2018), the broader “tech complex” is closer to 40% of the index. Adding Amazon, a Consumer Discretionary stock, would raise the number even higher. This composition shift explains why the market is structurally less sensitive to oil shocks than in prior cycles: the index’s largest constituents now sell software, advertising, and cloud services with minimal physical input costs.
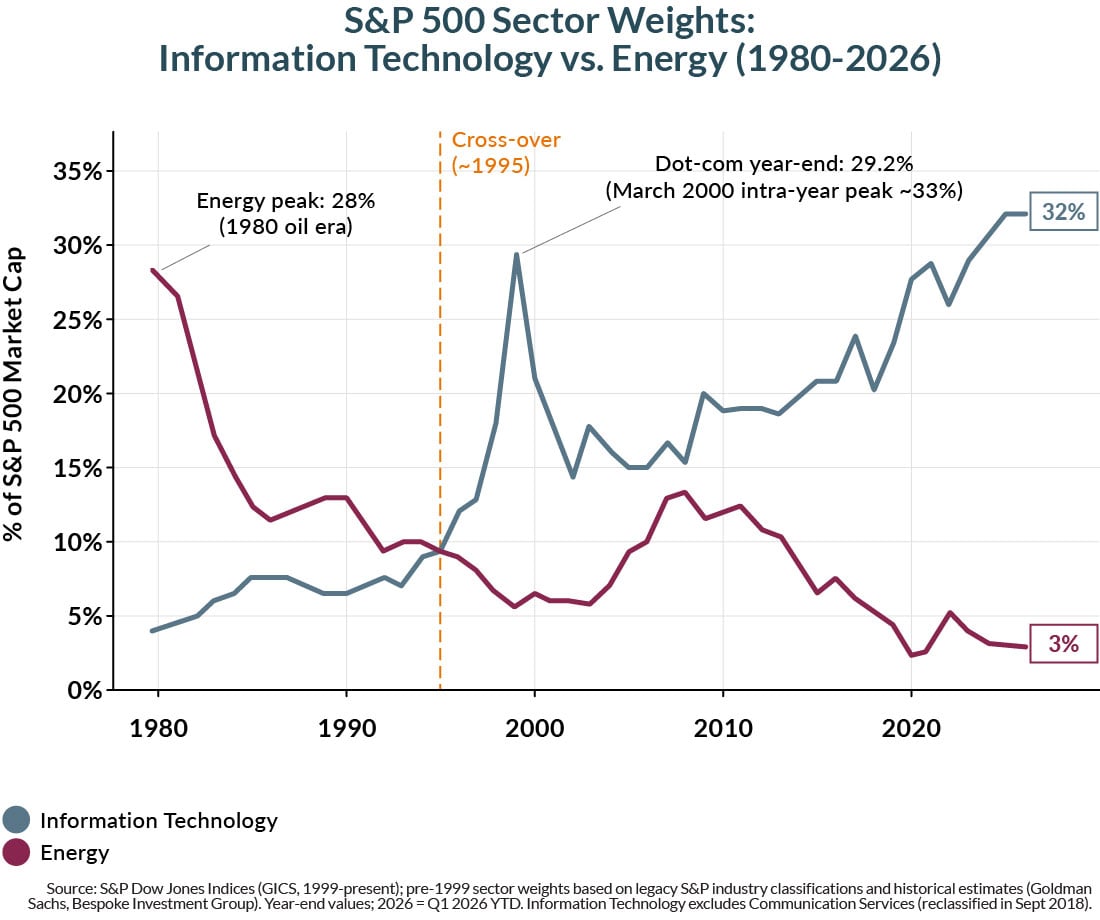
It also helps explain why higher valuations may be justified. An index dominated by growth technology companies with fat profit margins should demand a higher price than one dominated by slower growing energy, industrial, or consumer staples stocks. NVIDIA’s growth trajectory has more potential than Exxon’s.
Strong Earnings are Doing Most of The Work
At the most basic level, markets follow earnings—and earnings continue to be stronger than expected, especially within the tech sector.
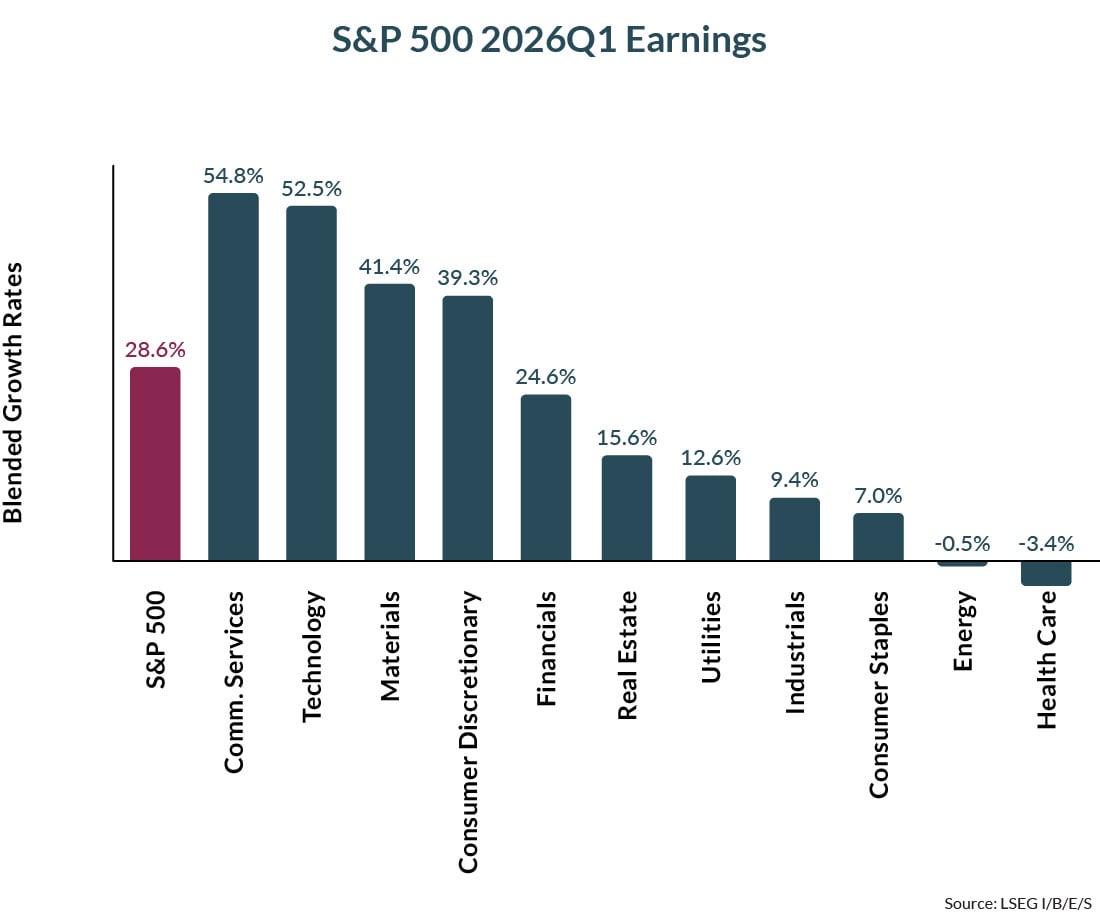
First quarter S&P 500 earnings growth is coming in at 28% year over year so far, with 83% of companies beating analysts’ expectations. Technology and Communication Services are leading the way with astounding 50%+ growth driven largely by the AI investment cycle. The "Magnificent 7" (Mag7) continue to outgrow the other 493 S&P 500 companies by a wide margin.
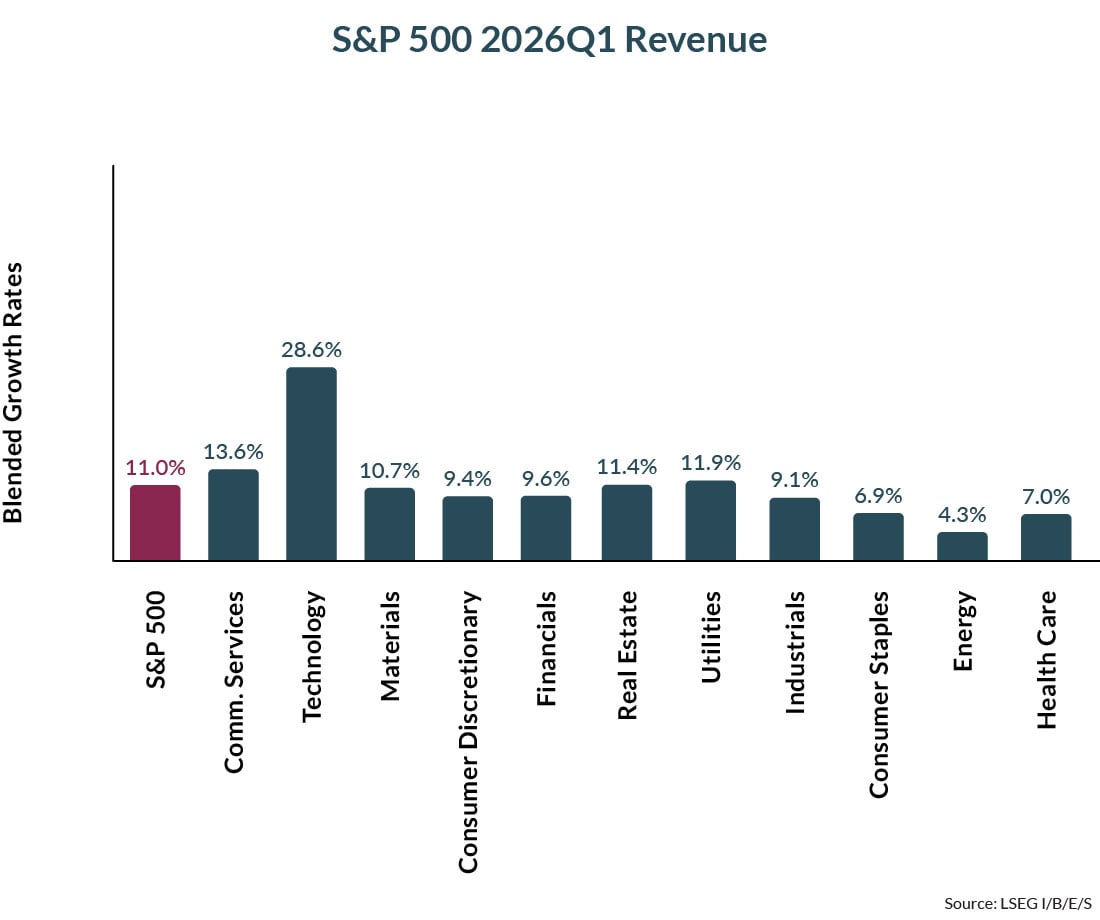
Higher valuations look more reasonable when contextualized with the fact the underlying businesses have been continuing to beat on the bottom line (earnings) and the top line (revenue) [Figure 2]. Stocks aren’t rising just because investors are paying more—companies are earning more. In fact, the Forward P/E has declined slightly from the peak as earnings growth has outpaced market gains.
The Consumer Is Less Vulnerable to Oil Shocks
Market composition and earnings are a big part of the market’s resilience, but not the only part. The consumers who fuel growth in the US are also less sensitive to oil prices.
Although the U.S. is now a net exporter of petroleum products and the economy is less exposed to oil price spikes than in the past, gas prices are still determined globally, and consumers still feel the impact. Just not as much as they used to.
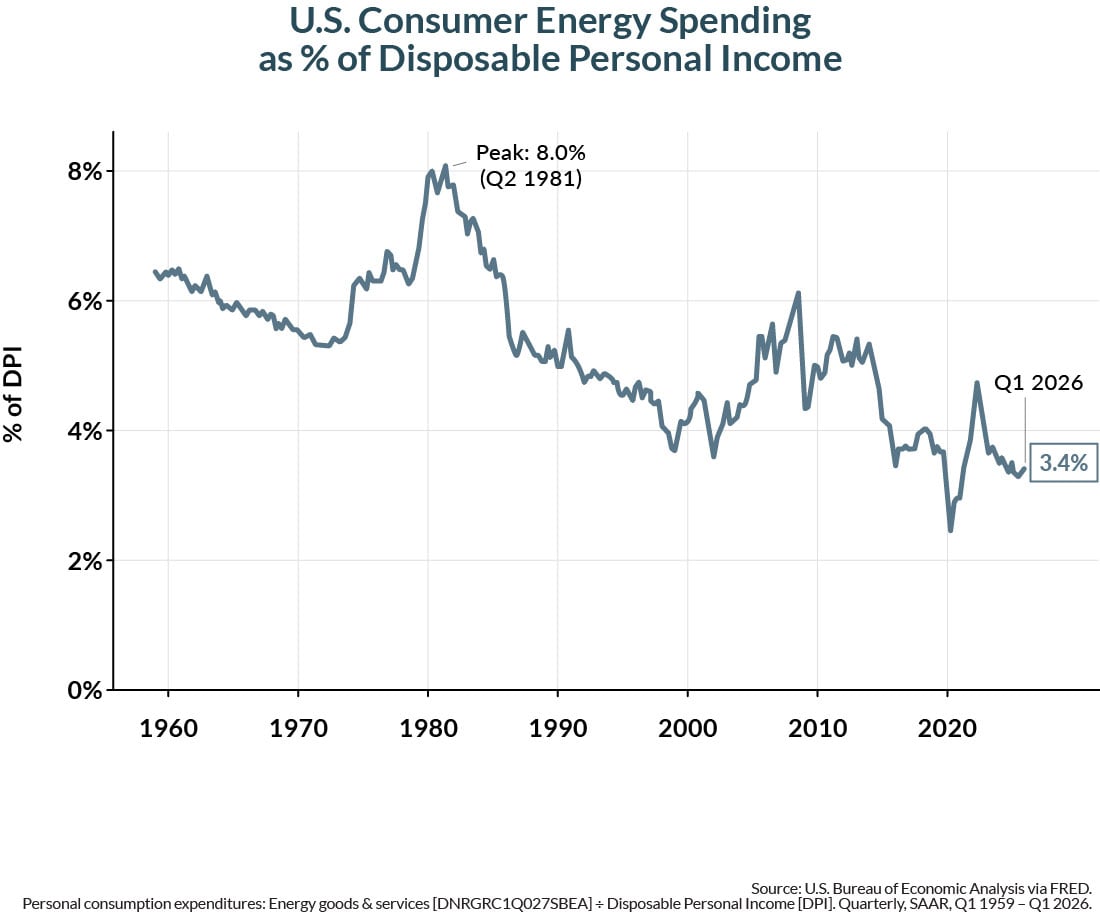
The chart below shows how energy spending has changed for U.S. households. Energy goods and services as a share of disposable personal income peaked near 8% in 1981 and has fallen to 3.4% today. Even the 2022 oil price spike pushed the ratio only briefly to 4.7% before retracing. The structural decline reflects efficiency gains across the economy and rising real incomes/net worths, diluting the share of the household wallet exposed to energy. A given dollar move in crude now consumes a meaningfully smaller share of consumer budgets than it did in prior cycles.
It is also true that not all consumers are feeling the same pressure. Higher income households now drive a greater share of consumer spending, and they are less impacted by high gas prices.
According to Federal Reserve data, from Q4 2019 through Q4 2025, the top 1% of U.S. households added roughly $22.5 trillion in net worth—nearly 10x more in absolute dollars than the entire bottom 50% combined (~$2.4T), despite the bottom half representing fifty times more households. The marginal consumer driving discretionary spending therefore has substantial accumulated wealth to draw on, which dampens the sensitivity of aggregate consumption to short-term shocks like gas-price spikes.
Rational Exuberance?
Markets may seem disconnected from headlines or how the economy feels to an average consumer, but the stock market reflects deeper changes in how the economy and stock market are composed today. Both the stock market and consumer are less vulnerable to oil shocks, and the large technology companies dominating the major stock market indices are experiencing tremendous profit growth that is reflected in investors’ willingness to pay up for future growth.
There are risks to this market rally. Index concentration makes the market vulnerable to anything that disrupts the AI investment cycle. Some tech companies themselves may be threatened by competition from AI that could make certain technologies obsolete. And inflation, if it persists, could result in higher bond yields that will be a headwind to growth and investment. But this rally isn’t driven by the “irrational exuberance” Alan Greenspan warned of in 1996. Earnings, the economy, and the consumer are telling a different story this time.
This information is for educational and illustrative purposes only and should not be used or construed as financial advice, an offer to sell, a solicitation, an offer to buy or a recommendation for any security. Opinions expressed herein are as of the date of this report and do not necessarily represent the views of Johnson Financial Group and/or its affiliates. Johnson Financial Group and/or its affiliates may issue reports or have opinions that are inconsistent with this report. Johnson Financial Group and/or its affiliates do not warrant the accuracy or completeness of information contained herein. Such information is subject to change without notice and is not intended to influence your investment decisions. Johnson Financial Group and/or its affiliates do not provide legal or tax advice to clients. You should review your particular circumstances with your independent legal and tax advisors. Whether any planned tax result is realized by you depends on the specific facts of your own situation at the time your taxes are prepared. Past performance is no guarantee of future results. All performance data, while deemed obtained from reliable sources, are not guaranteed for accuracy. Not for use as a primary basis of investment decisions. Not to be construed to meet the needs of any particular investor. Asset allocation and diversification do not assure or guarantee better performance and cannot eliminate the risk of investment losses. Certain investments, like real estate, equity investments and fixed income securities, carry a certain degree of risk and may not be suitable for all investors. An investor could lose all or a substantial amount of his or her investment. Johnson Financial Group is the parent company of Johnson Bank and Johnson Wealth Inc. NOT FDIC INSURED * NO BANK GUARANTEE * MAY LOSE VALUE
ABOUT THE AUTHOR