
Wealth Insights
The US Dollar and Why International Stocks are Outperforming YTD
5 minute read time
For years, many investors have wondered, “Why do I own any international stocks when US equities have performed so much better?”
But with year-to-date performance of foreign stocks in the double digits versus the low single digits for US equities, a new question has emerged: “Why are international stocks doing so much better than US equities?”
To answer that question, we need to look at the role the US dollar (USD) plays in the relative performance of US vs. international equities.
A good place to start is the DXY Index, which measures the USD against a basket of foreign currencies. As you can see, from 2012 to 2025 the USD has appreciated significantly relative to other currencies.
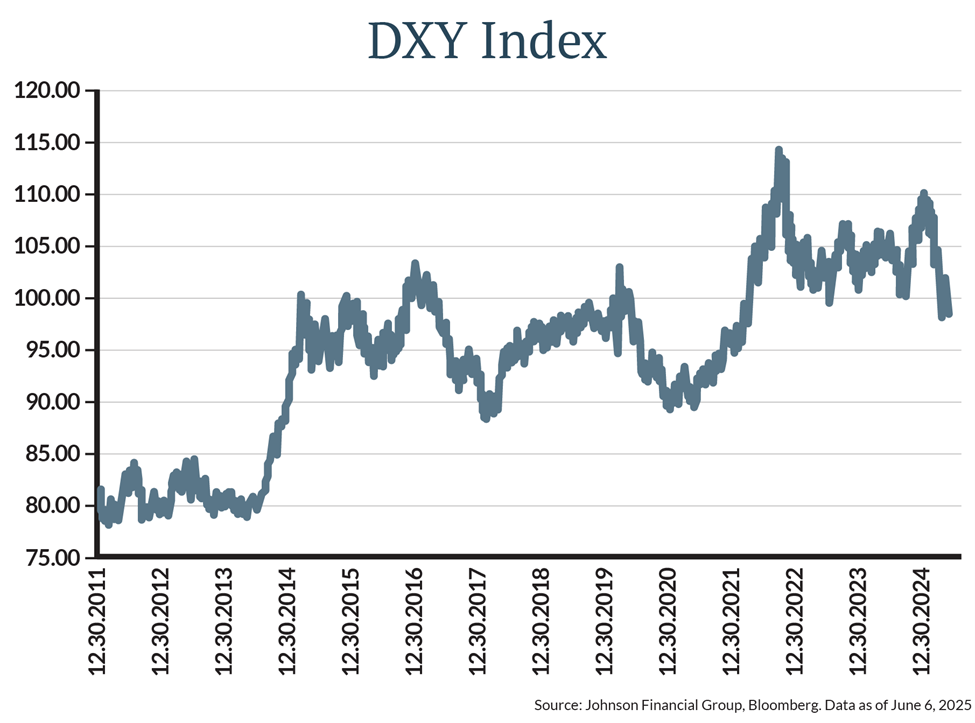
But why does that matter for the stock market?
Let us look at how US equities have performed versus international equities across different regimes of dollar strength or weakness using the same index. The chart below shows cumulative returns during periods when the S&P 500 Index outperformed or underperformed international stocks, as represented by the MSCI EAFE Index (which captures large and mid-cap stocks across Developed Markets around the world, excluding the US and Canada.):
- In the chart, the dark-blue color above the 0% line indicates US equities outperforming international stocks. Similarly, light blue above the 0% line shows the dollar outperforming other currencies.
- When the dark-blue color appears below the 0% line, we saw international stocks outperforming their US counterparts.
- Note that for the most part, the dark-blue and light blue colors are either both above or both below the 0% line.
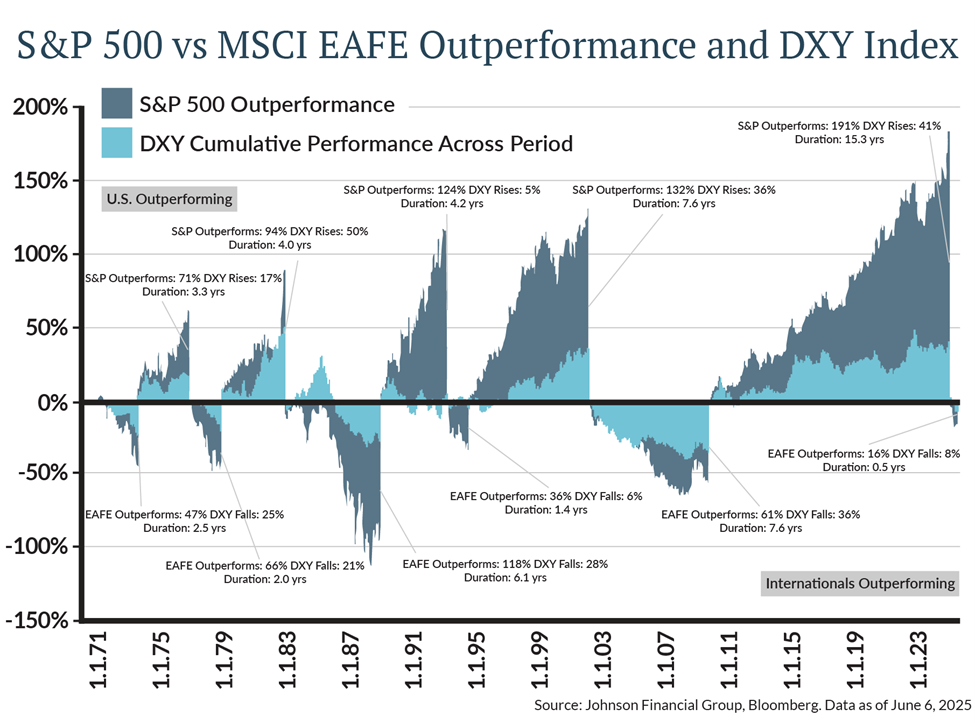
As you can see there has historically been a relationship between the USD strengthening and US equities outperforming.
And logically this follows, because:
- For companies, imports of goods or services from foreign countries become cheaper when their local currency is stronger. Simultaneously, the goods it exports abroad become more expensive to the company’s customers, which is a benefit assuming customers don’t or can’t switch to a replacement product.
- For investors, when the USD strengthens, returns in USD denominated assets increase more for foreign investors whose local currencies have depreciated. This makes US assets even more attractive to foreign investors, increasing the amount of capital flowing to the US from abroad.
Let’s look at an example of the currency effect on a US investor investing in foreign equities. Say at the beginning of this year I bought one share of Danish pharmaceutical company Novo Nordisk’s Class B Shares. I would have first given my broker my hard-earned dollars. She then exchanged those for euros and bought one share. Fast forward to today, how much cash (return) am I getting back for selling my euro-based share? Using hypothetical numbers, here is what it would look like. These figures assume the USD had weakened—like it has YTD—and the shares did not move an inch. The upshot is a 12.2% return despite no change in the share price.
| Beginning of 2025 | Current Date (June 13, 2025) | |
| Novo Nordisk Share Price1 | €500.00 | €500.00 |
| €$ € $ Exchange rate1 | $1.025 / €1 | $1.150 / €1 |
| $ Value Per Share | €500.00 ∗$1.025=$512.50 | €500.00 ∗$1.150=$575 |
| Return in USD | --- | ($575−$512.50)=$62.50 or 12.20% |
| Return in EUR | --- | (€500.00−€500.00)=€0 or 0% |
1Numbers are hypothetical
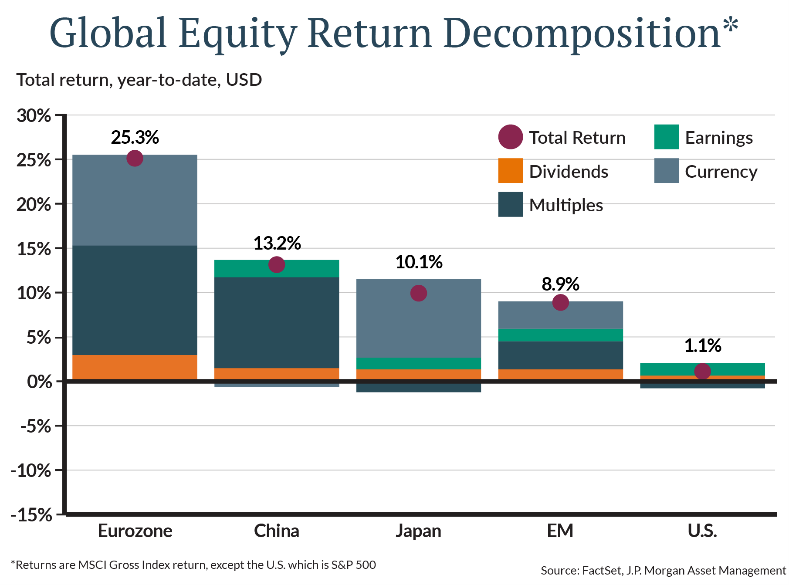
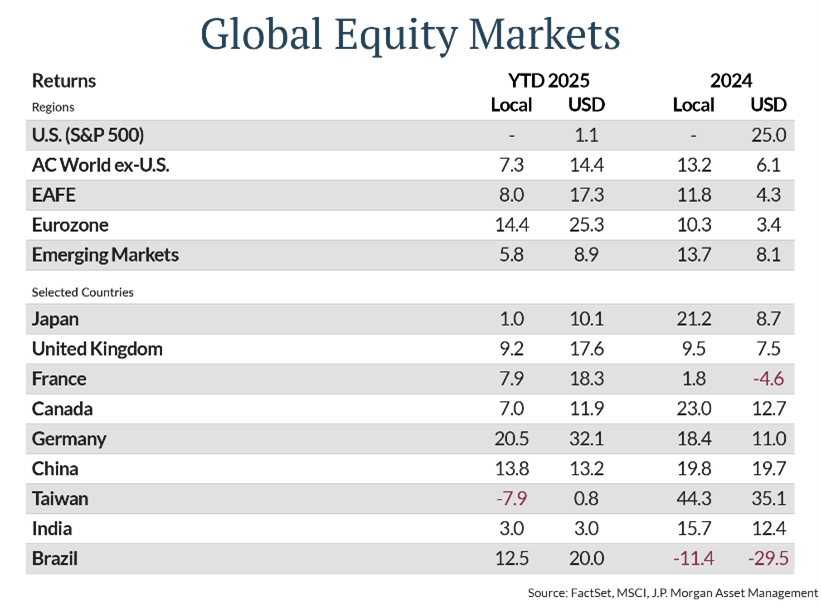
To explore this same idea in a broader context, we’ll next look at how different regions performed in USD versus in their local currencies and how much of their return (for a US investor) was due to changes in currency values.
The first chart below illustrates the percentage of YTD total returns attributed to currency moves in different international markets. In the second chart, note the large currency impact on Japanese stocks over the past 2 years. In 2024 a US investor’s return was less than half of the return received by a Japanese investor. However, YTD Japanese investments have performed ten times better for US investors than they have for Japanese investors!
Case for Continued International Allocation
Now that we’ve discussed what has already happened, let’s consider the future and why it is equally important to continue holding international equities even after this recent rally.
JP Morgan annually publishes a report including many economic data points as well as their expectations of annualized returns for US investors across the next 10-15 years for many different assets. The most recent version published forecasts international outperforming US equities. A key component of this forecast assumes that the USD would/will continue to weaken.
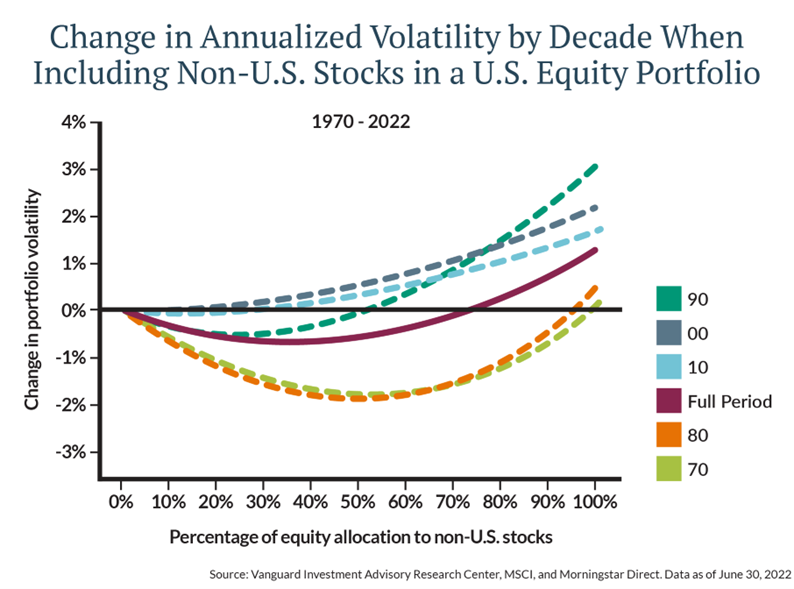
But absolute returns aren’t the only reason to continue holding internationals. Diversifying geographically reduces the risks associated with market concentration and currency fluctuation, reducing portfolio volatility while taking advantage of the full global opportunity set available to investors. Vanguard research published in 2023 found that holding international equities at a 30-40% allocation optimally reduced volatility within a U.S. equity portfolio, as reflected in the following chart.
It’s impossible to predict with certainty which country’s equities will perform the best in any given year on an absolute basis let alone a currency-adjusted basis. But, as we saw pre- and post-Liberation Day this year, foreign companies can zig when US companies zag.
Over long periods of time, an allocation to international equities has smoothed volatility and helped keep your portfolio value moving up when a more concentrated portfolio might have suffered periods of sustained underperformance.
This information is for educational and illustrative purposes only and should not be used or construed as financial advice, an offer to sell, a solicitation, an offer to buy or a recommendation for any security. Opinions expressed herein are as of the date of this report and do not necessarily represent the views of Johnson Financial Group and/or its affiliates. Johnson Financial Group and/or its affiliates may issue reports or have opinions that are inconsistent with this report. Johnson Financial Group and/or its affiliates do not warrant the accuracy or completeness of information contained herein. Such information is subject to change without notice and is not intended to influence your investment decisions. Johnson Financial Group and/or its affiliates do not provide legal or tax advice to clients. You should review your particular circumstances with your independent legal and tax advisors. Whether any planned tax result is realized by you depends on the specific facts of your own situation at the time your taxes are prepared. Past performance is no guarantee of future results. All performance data, while deemed obtained from reliable sources, are not guaranteed for accuracy. Not for use as a primary basis of investment decisions. Not to be construed to meet the needs of any particular investor. Asset allocation and diversification do not assure or guarantee better performance and cannot eliminate the risk of investment losses. Certain investments, like real estate, equity investments and fixed income securities, carry a certain degree of risk and may not be suitable for all investors. An investor could lose all or a substantial amount of his or her investment. Johnson Financial Group is the parent company of Johnson Bank and Johnson Wealth Inc. NOT FDIC INSURED * NO BANK GUARANTEE * MAY LOSE VALUE
ABOUT THE AUTHOR